In commercial and industrial facilities, heat is often the first visible sign of a developing electrical problem. Loose connections, overloaded circuits, and failing components generate excess heat before they fail. Infrared thermography makes these conditions visible, helping maintenance teams identify risks that would otherwise go unnoticed during routine inspections.
This article breaks down how infrared thermography works in the electrical space, what it detects, and how inspections are performed. It also covers key limitations, testing frequency, and how results are interpreted in practice. The goal is to provide a clear, practical understanding for facility managers and decision makers responsible for maintaining reliable electrical systems.
What Is Infrared Thermography
Infrared thermography is a diagnostic method used to evaluate electrical systems by detecting heat patterns on the surface of equipment. It works by capturing infrared radiation emitted by energized components and converting it into a visual image, often referred to as a thermogram. These images highlight temperature differences that are not visible to the naked eye.
In electrical applications, this process is performed while the equipment is under normal operating load. That matters because many issues only appear when current is flowing. The process relies on specialized thermal imaging cameras.
These cameras measure surface temperature and display variations using color gradients. Warmer areas may indicate resistance, overloading, or component degradation. Cooler areas can also signal abnormal conditions, depending on the context.
What Infrared Thermography Detects In Electrical Systems
Infrared thermography is used to identify abnormal heat patterns that point to developing electrical issues. These issues often do not show up during visual inspections or standard testing. Here are the top four things infrared thermography can reveal in your facility’s electrical system:
Loose Or High-Resistance Connections
Loose or deteriorated connections create resistance at contact points. That resistance generates heat as current flows through the connection. Over time, this can lead to insulation damage or equipment failure.
Thermal imaging typically shows these issues as localized hot spots at terminals, lugs, or bus connections, even when the rest of the equipment appears normal.
Overloaded Circuits And Imbalance
Circuits that carry more current than intended will run hotter than their design allows. Similarly, phase imbalance in three-phase systems can cause uneven heating across conductors.
Infrared thermography highlights these conditions by comparing temperature differences between phases or similar components, making it easier to identify load-related issues before protective devices trip.
Failing Breakers, Switches, And Panels
As electrical components age, internal wear can increase resistance. Breakers, disconnects, and panelboards may begin to overheat at specific points. This is not always visible externally.
Thermal scans help identify these early signs. A component running hotter than comparable equipment under the same load is often an indicator of internal degradation.
Insulation Breakdown And Hidden Defects
Insulation failures and internal faults can also present as abnormal heat patterns. While thermography does not see through materials, it can detect surface temperature changes caused by internal issues.
This is particularly useful for identifying hidden defects in cables, terminations, and enclosed equipment, where traditional inspection methods have limited visibility.
Why Infrared Thermography Is Used In Electrical Maintenance
Infrared thermography is widely used because it provides insight into how electrical systems are performing under real operating conditions. Unlike shutdown testing, it captures issues while equipment is energized and carrying load. This makes it a practical tool for identifying problems that only appear during normal operation.
In maintenance programs, thermography is typically used alongside other inspection methods to support decision making. It does not replace electrical testing, but it helps teams focus attention on areas that show signs of stress or abnormal behavior.
Identifying Overheating Components
Most electrical failures are preceded by a rise in temperature. Connections degrade, loads shift, and components begin to operate outside their normal range.
Infrared thermography allows maintenance teams to locate these overheating points early, often before there are visible signs of damage or performance issues.
Reducing Unplanned Downtime
Unplanned outages are often tied to failures that develop over time. Without visibility into operating conditions, these issues can go unnoticed until equipment trips or fails.
Thermal imaging helps address this by highlighting developing risks. Facilities can plan repairs based on observed conditions rather than reacting to failures, which is especially relevant in environments where shutdowns disrupt operations.
Supporting Safety And Compliance Requirements
Electrical safety standards place emphasis on identifying hazards before work is performed. Overheated components increase the risk of arc flash and equipment failure.
Infrared thermography supports compliance efforts by helping document equipment condition and identify potential hazards, particularly when aligned with maintenance practices referenced in standards such as NFPA 70B and workplace safety requirements.
Limitations Of Infrared Thermography
Infrared thermography is a useful diagnostic tool, but it has clear limitations. It should be understood as one part of a broader maintenance strategy, not a standalone solution.
The most common limitations include:
- Only detects heat-related issues. Problems that do not generate a temperature difference will not appear in a scan. Early-stage faults may go unnoticed.
- Requires equipment to be under load. If systems are not operating at normal or sufficient load, temperature differences may not be visible, reducing the value of the inspection.
- Limited visibility of internal components. Thermal cameras measure surface temperature. Enclosed equipment or internal faults may not be directly visible.
- Environmental conditions can affect accuracy. Airflow, ambient temperature, and reflective surfaces can distort readings or mask actual conditions.
- Interpretation depends on technician expertise. Not every hot spot indicates a failure. Accurate analysis requires experience and context, especially in complex electrical systems.
Because of these limitations, infrared thermography is typically used alongside other inspection and testing methods to build a complete picture of system condition.
How Electrical Infrared Thermography Inspections Are Performed
Infrared thermography inspections follow a structured process designed to capture accurate data while equipment is operating. The process typically includes the following steps:
Preparation And Safety Considerations
Before any scanning begins, the inspection scope is defined and equipment access is reviewed. This includes identifying critical assets, reviewing one-line diagrams, and coordinating with facility teams.
Safety is a key part of this phase. Technicians follow electrical safety requirements, including arc flash boundaries and appropriate PPE, especially when working in live environments such as healthcare or manufacturing facilities.
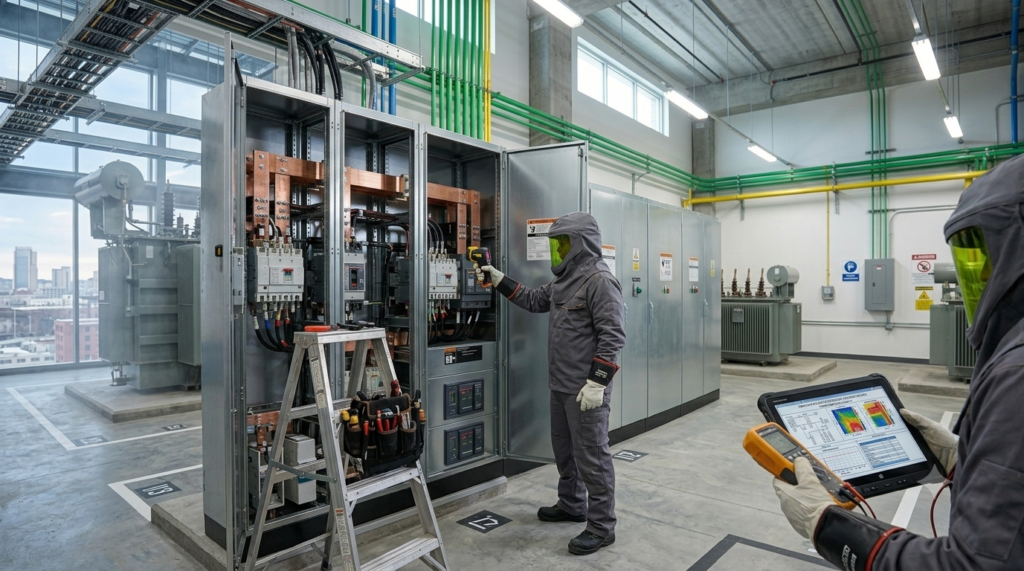
Scanning Equipment Under Load
Thermal imaging is performed while equipment is energized and carrying normal load. Panels, switchgear, transformers, and distribution equipment are scanned systematically.
Consistent load conditions are important for reliable results, since temperature differences are only meaningful when equipment is operating under comparable conditions.
Capturing Thermal Images And Data
During the scan, technicians capture thermal images along with standard visual images for reference. Key data points such as load conditions, ambient temperature, and equipment details are also recorded.
This documentation helps provide context for later analysis. Each image is tied to a specific asset and operating condition, which is critical for accurate interpretation.
Analyzing Temperature Differences
After data collection, images are reviewed to identify abnormal temperature patterns. Components are compared against similar equipment or expected operating ranges.
Findings are typically categorized by severity based on temperature rise and condition, helping maintenance teams prioritize corrective actions. In more complex facilities, this analysis is often integrated into a broader maintenance program to track trends over time.
How Often Should Infrared Thermography Be Performed?
Infrared thermography for electrical systems is typically performed annually, as referenced in NFPA 70B, with more frequent inspections for higher-risk equipment. Most commercial and industrial facilities follow a minimum annual schedule, while critical systems, heavily loaded equipment, or aging infrastructure may be inspected semi-annually or quarterly.
Non-critical equipment may be assessed less frequently, and additional scans are often performed after major repairs, new installations, or when a fault is identified, to verify system condition under load.
Interpreting Infrared Thermography Results
Thermal images provide useful data, but their value depends on how they are interpreted. The goal is to identify abnormal temperature differences and understand what they indicate about equipment condition, not just to flag hot spots. Context matters, including load levels, equipment type, and comparison to similar components.
Temperature Rise And Severity Levels
Findings are typically evaluated based on temperature rise relative to similar components or ambient conditions. Industry practices often categorize issues by severity to guide response.
| Temperature Difference (ΔT) | Typical Condition | Recommended Action |
| 1–10°C | Minor variation | Monitor over time |
| 11–20°C | Moderate issue | Schedule maintenance |
| 21–40°C | Serious condition | Plan repair soon |
| >40°C | Critical | Immediate action required |
Higher temperature differences generally indicate higher resistance or load-related stress, but interpretation must account for operating conditions at the time of the scan.
Common Reporting Formats
Thermography results are usually documented in a structured report that typically includes:
- Temperature readings
- Severity classification
- Thermal and visual images
- Written observations
- Recommended actions
Each finding is tied to a specific asset and location.
Infrared Thermography Vs Other Electrical Testing Methods
While infrared thermography is one of the most impactful tools used to assess electrical system condition, it’s not the only one that should be used. No single method provides a complete picture, which is why thermography is often used alongside other testing approaches.
Here is how infrared thermography differs from other testing methods:
Infrared Vs Ultrasonic Testing
Ultrasonic testing detects high-frequency sound produced by electrical discharge, arcing, or tracking. It is commonly used for identifying issues in enclosed or inaccessible equipment.
Infrared thermography identifies heat, while ultrasonic testing detects sound-related anomalies, making the two methods complementary in identifying early-stage faults.
Infrared Vs Visual Inspections
Visual inspections rely on what can be seen without specialized equipment. This includes signs such as discoloration, corrosion, or physical damage.
Thermography goes beyond visual inspection by revealing temperature differences that are not visible, allowing earlier identification of developing issues.
Infrared Vs Electrical Testing (NETA, Insulation Resistance)
Electrical testing methods such as insulation resistance testing and NETA-based testing evaluate the performance and integrity of electrical components. These tests often require equipment to be de-energized.
Infrared thermography is non-intrusive and performed under load, while electrical testing provides deeper diagnostic data, making both necessary for a well-rounded maintenance program.
Choose A Qualified Infrared Thermography Provider
Thermal images alone do not explain what is happening inside an electrical system. That’s where certified technicians and service providers can help. These experts understand electrical distribution and load behavior, and know how to interpret temperature differences in context. Without that expertise, findings can be misread or lack the detail needed for decision making.
For facilities with complex or live electrical systems, it is important to work with providers who regularly operate in those environments. C&H Electric performs infrared thermography as part of a broader maintenance approach, with experience in mission-critical systems and compliance-driven work.
Our infrared inspections are conducted with a focus on usable data, clear reporting, and alignment with ongoing maintenance programs, so findings can be applied in a practical way.